
The World’s Records: Which Countries Have Advanced The Most Since Their Olympic or Paralympic Debut?
The Olympic Games has a rich and extensive history, dating back to Ancient Greece. The modern version of the Games, however, was resurrected in Athens in 1896, marking the beginning of the global sporting event we know today.
Since their revival, the Games have taken place every four years, except World Wars I and II. Over time, the range of sports, the number of participating nations, and the capabilities of athletes has evolved drastically. Coupled with advances in performance technology and analysis, a greater understanding of nutrition and different levels of funding, we were keen to find out which nations have made the most substantial athletic advancements since their Olympic debut.
We also worked with Damian Bailey, a Professor of Physiology & Biochemistry at the University of South Wales, to answer the question - is there a limit to human performance?
Damian shared his thoughts with us, “While we’re not quite there yet, there are limits to what we as humans can achieve in terms of both physiological and psychological performance. In fact, scientific studies show that world records across most sports have slowed down over the last 20-30 years, and simple mathematics tells us that there is a finite limit to human performance."
He added, “But all this said, from an evolutionary point of view, being competitive is in our DNA. Our brains have evolved (and continue to evolve!) to be ‘smarter’ than any other animal and we will undoubtedly invent new and innovative ways to overcome this performance stagnation.
“With more sophisticated data monitoring, we will have richer information that athletes and coaches can use to further optimise strategies in training and competition to streamline new breakthroughs that push athletes to set new world records.”
So, without further ado, which countries have advanced the most over the last 128 years?
ㅤ
How We Calculated Each Country’s Improvement – Olympics
To decide how much different countries have progressed since their Olympic debut, we compared their best recorded performance from their debut year, with their most recent results at the Paris 2024 Olympics. To ensure a fair and relevant comparison, we only included countries that took part in the same events at both their debut and the 2024 Games, focusing on current athletic performance.
We also considered which sports might be the fairest to analyse. After all, with the first modern Olympics being held over 100 years ago, many aspects have evolved! We found four sports - the 100m sprint, the 100m freestyle, team pursuit and single sculls - that have undergone the least significant changes in rules, equipment and format over time. Comparing these events gave us the fairest comparison of how different nations have progressed athletically.
ㅤ
Running - The 100m Sprint Race
ㅤ
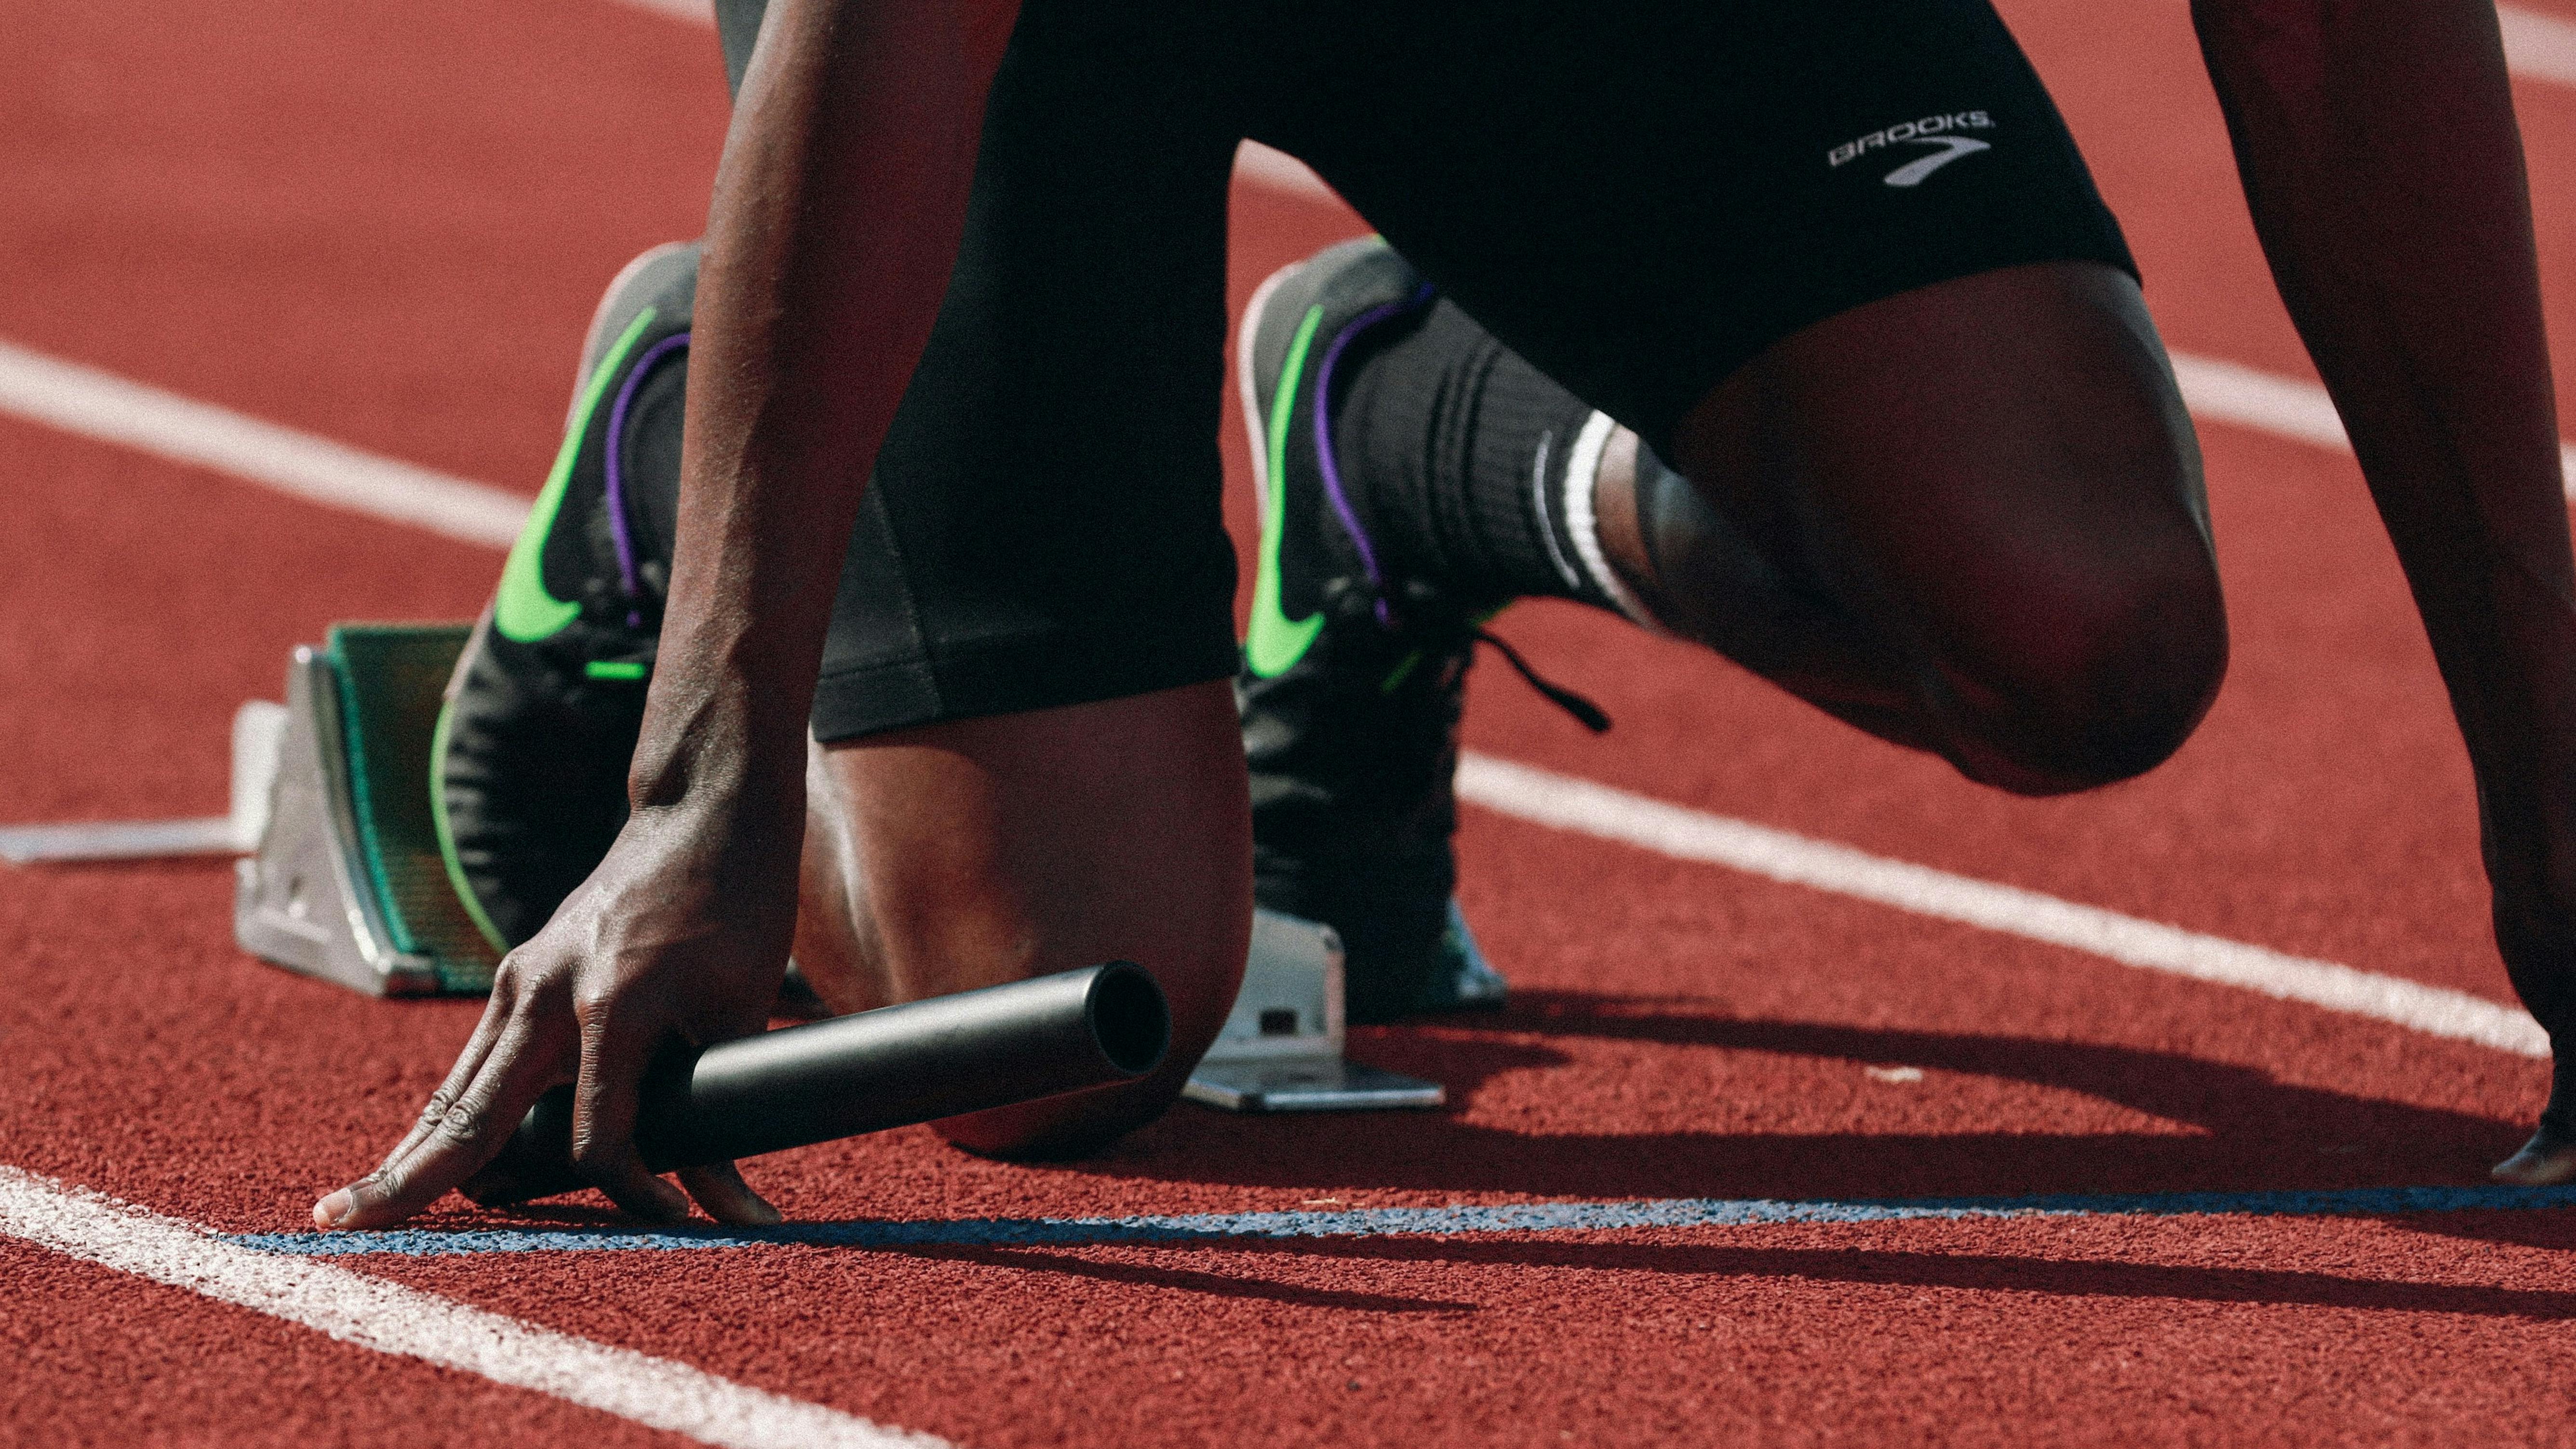
Photo credits: Braden Collum on Unsplash
ㅤ
One of the most iconic events in athletics, the 100m sprint has been a staple of the Olympic Games since its debut in 1896 for men, and 1928 for women. Over the years, athletes have consistently pushed the boundaries of speed, and world records have been shattered. Most recently, Usain Bolt’s 2009 world record of 9.58 seconds still stands as one of the most incredible feats in the sport.
Damian pointed out just how hard it is to set a new world record in the 100m sprint, “Research highlights that since 2000, 6% of all world records belonged to track and field events while swimming accounted for a whopping 40%! In fact, since 1912, the world record in the men’s 100m freestyle has improved by 24%, compared to less than 10% in the men’s 100m sprint.
“Part of the difference here is that swimming strokes are far more complex than running, offering more potential for optimization and future records. Equally, the pool is a more controlled environment whereas track running is subject to unpredictable differences in temperature and humidity.”
So, is there any possibility of breaking Usain Bolt’s Record? Damian isn’t sure, “modern-day athletes like Bolt, Sweden’s Duplantis (who has broken the pole-vaulting world record nine times since 2020) or Ukraine’s Mahuchikh (who beat the women’s high jump record by 1cm) are simply considered exceptional athletes at the top of their game, seemingly unbeatable genetic wonders of nature”.
Advances in sprint training techniques and biomechanics, combined with better track surfaces and improved running shoe technology, have played a crucial role in these performance gains. As technology continues to evolve, athletes are continually pushing the limits of human speed, so who knows? Perhaps we’ll see even more record-breaking performances in the 100m sprint yet.
ㅤ
Top 10 Most Improved Countries in the Men’s 100m Sprint
ㅤ
| RANK | COUNTRY | CONTINENT | % IMPROVEMENT* | YEARS COMPETED |
| 1. | USA | North America | -18.42% | 128 |
| 2. | Italy | Europe | -12.05% | 104 |
| 3. | Japan | Asia | -11.86% | 76 |
| 4. | Iraq | Asia | -11.76% | 40 |
| 5. | China | Asia | -11.65% | 92 |
| 6. | Botswana | Africa | -11.57% | 44 |
| 7. | Sweden | Europe | -10.96% | 112 |
| 8. | Liberia | Africa | -10.80% | 68 |
| 9. | Thailand | Asia | -10.35% | 72 |
| 10. | Ghana | Africa | -10.11% | 72 |
*(From first, and fastest, to most recent fastest performance)
ㅤ
When it comes to the most improved men’s 100m sprint, it’s team USA that takes gold. American athletes have made the most significant improvement in performance, competing for 128 years and speeding up their sprint to reduce their time by 18.42%.
Similarly, Italy, China and Sweden have also seen notable gains during long tenures in the sport. Italy, competing for 104 years, improved by 12.05%, while China (92 years) and Sweden (112 years) saw 11.65% and 10.96% improvements, respectively.
Iraq and Botswana also stand out here, each having improved their performance in the men’s 100m sprint by over 11.5% in just 40 and 44 years, less than half the time that other countries in the top 10 have been competing for, with investments in athletics and sport science advancements in recent decades likely driving these rapid gains.
ㅤ
Top 10 Most Improved Countries in the Women’s 100m Sprint
ㅤ
| RANK | COUNTRY | CONTINENT | % IMPROVEMENT* | YEARS COMPETED |
| 1. | Switzerland | Europe | -25.24% | 72 |
| 2. | Belgium | Europe | -18.38% | 76 |
| 3. | Italy | Europe | -16.91% | 96 |
| 4. | Singapore | Asia | -15.72% | 72 |
| 5. | Laos | Asia | -14.84% | 44 |
| 6. | New Zealand | Oceania | -14.77% | 96 |
| 7. | France | Europe | -14.38% | 96 |
| 8. | Brazil | South America | -14.24% | 76 |
| 9. | Sao Tome and Principe | Africa | -14.12% | 28 |
| 10. | Iran | Asia | -12.80% | 60 |
*(From first, and fastest, to most recent fastest performance)
ㅤ
Switzerland leads the pack for the women’s 100m sprint with a remarkable 25.24% improvement over the past 72 years, cutting 3.7 seconds from their time since their debut in 1952. Though not traditionally known for sprinting, their progress is notable. Belgium follows closely behind, with their athletes running 18.38% faster now, compared with their first performance 76 years ago.
Italy, New Zealand, and France, all having been competing for 96 years already, have also seen impressive gains. Mirroring the gains they’ve seen in the men’s 100m sprint, Italy’s time over the distance has decreased by 16.91% for the women, while New Zealand, typically known for their rugby success, has also improved by 14.77%.
Smaller nations have shown equally impressive strides. Sao Tome and Principe for example improved by 14.12% in just 28 years, while Laos, another nation with less of an athletic infrastructure, increased their speed by 14.84% in 44 years. Even in Iran, where female participation in sport has faced cultural barriers, athletes improved by 12.80% over 60 years, reflecting greater access to sports and international competition.
ㅤ
Swimming - The 100m Freestyle Race
ㅤ
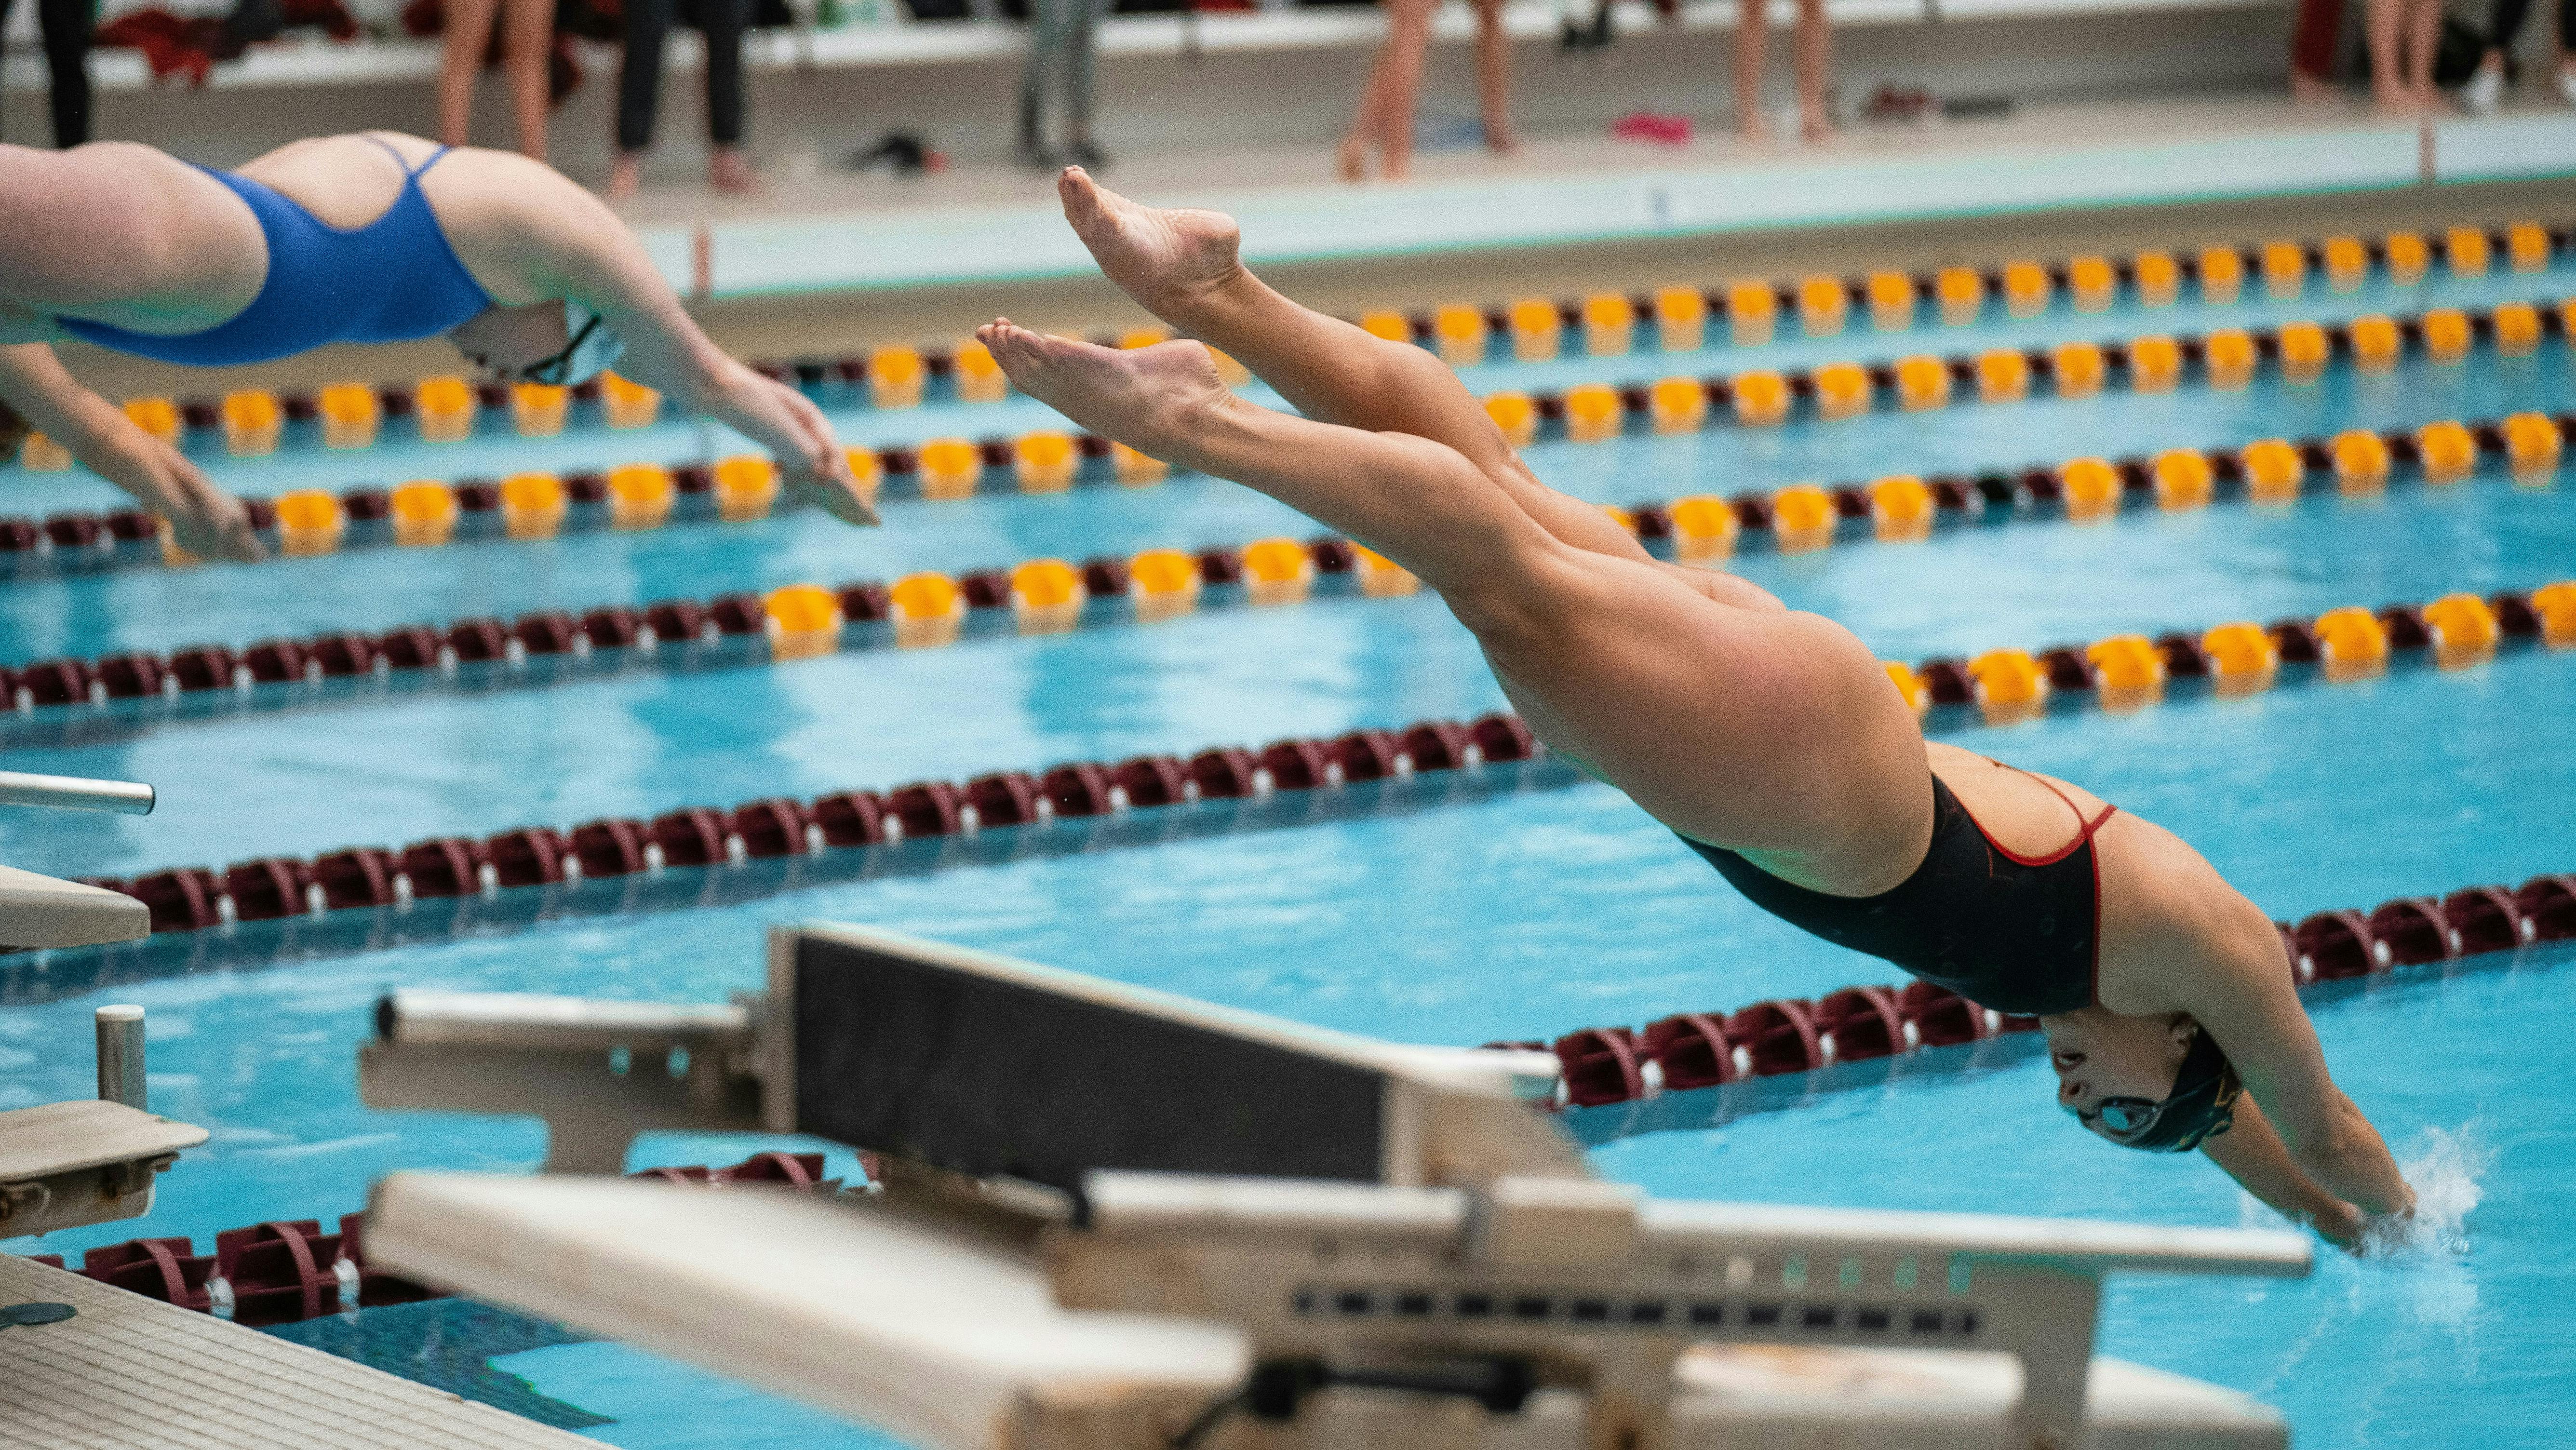
Photo credits: Jacob Rice on Unsplash
ㅤ
One of the oldest and most prestigious swimming events, the 100m freestyle has been contested by men since 1896 and women since 1912. Though high-tech swimming gear used in the sport has stirred controversy, athletic improvements have continuously broken world records. Just this year, Pan Zhanle shocked viewers, beating Kyle Chalmers by 1.08 seconds to set a new world record at the Paris Games.
Damian weighed in on this shock performance. "Pan Zhanle obliterated his own world record with an unfathomably quick 46.40 seconds, blowing away the typical tight margins in the men’s 100m freestyle. This remarkable performance stands as a testament to the fact that we still don’t fully understand the science underpinning the limits of human performance, and that records will continue to be broken in the foreseeable future”.
Swimwear technology, along with innovations in pool design and advanced training methods like underwater cameras and stroke analysis, has been a key driver of performance improvements in the sport. Damian told us that “The introduction of woven elastane-nylon and polyurethane swimsuits in the 2008 Beijing Games resulted in a 3% performance gain and saw world records broken in 19 events, making swimmers more buoyant and allowing them to slip through the water, before they were subsequently banned.”
Even despite this ban however, athletes continue to push the boundaries of speed thanks to cutting-edge training and increased funding for facilities and coaching.
ㅤ
Top 10 Most Improved Countries in the Men’s 100m Freestyle
ㅤ
| RANK | COUNTRY | CONTINENT | % IMPROVEMENT* | YEARS COMPETED |
| 1. | Canada | North America | -45.75% | 116 |
| 2. | Brazil | South America | -41.39% | 104 |
| 3. | France | Europe | -36.24% | 112 |
| 4. | Hungary | Europe | -36.11% | 128 |
| 5. | Spain | Europe | -35.30% | 100 |
| 6. | Great Britain (GB) | Europe | -33.36% | 116 |
| 7. | Netherlands | Europe | -33.28% | 116 |
| 8. | Italy | Europe | -33.11% | 112 |
| 9. | China | Asia | -30.23% | 88 |
| 10. | Sri Lanka | Asia | -25.43% | 72 |
*(From first, and fastest, to most recent fastest performance)
ㅤ
Canada takes the gold for the most significant improvement in the 100m freestyle, with athletes completing the race 45.75% faster than at their debut 116 years ago. Canadian athletes now complete the race in just over 50 seconds, down from 95 seconds in 1908. This improvement is the largest of all countries that competed in the 100m freestyle in Paris 2024 that had previously competed in another Olympic Games, and is indicative of the country’s heritage in swimming, a sport which is heavily supported by government funding and programmes like Swimming Canada.
Another country who has taken part in swimming for over a century is Brazil, who in their 104-year tenure in the sport have reduced their race time by 41.39%. Brazilian athletes received help from a boost in the country’s investment in Olympic sports ahead of their hosting the 2016 Rio Olympics, while Spain, whose men’s freestyle race times are now 35.30% faster, also hosted an Olympic Games in 1992 in Barcelona.
There are other notable countries to highlight too - China for example, have improved their speed by 30.23% over 88 years, and Sri Lanka have dropped their freestyle race time by 25.43% in 72 years. Both significant boosts to their performance can be put down to enhancements in training facilities and widespread participation in competitions across the globe.
ㅤ
Top 10 Most Improved Countries in the Women’s 100m Freestyle
ㅤ
| RANK | COUNTRY | CONTINENT | % IMPROVEMENT* | YEARS COMPETED |
| 1. | Sweden | Europe | -49.85% | 112 |
| 2. | Netherlands | Europe | -36.04% | 104 |
| 3. | China | Asia | -35.75% | 88 |
| 4. | France | Europe | -35.53% | 104 |
| 5. | Australia | Oceania | -35.06% | 96 |
| 6. | Great Britain | Europe | -32.74% | 112 |
| 7. | Hong Kong | Asia | -31.86% | 72 |
| 8. | USA | North America | -28.95% | 104 |
| 9. | Philippines | Asia | -27.18% | 68 |
| 10. | Canada | North America | -23.72% | 88 |
*(From first, and fastest, to most recent fastest performance)
ㅤ
Sweden, who have competed in the 100m women’s freestyle race for 112 years, have seen the most remarkable improvement of our entire study, nearly halving its athletes race time since their debut. With athletes like Sarah Sjöström showcasing the best the country has to offer, Sweden’s investment in its training opportunities for budding swimmers is paying off.
The next biggest improvement in our study of the women’s 100m freestyle comes from the Netherlands, who have decreased their race time by 36.04% in 104 years, while in the same breath, other notable countries like China, France, Australia and Great Britain have made significant leaps in performance - improving their race time between 32.74% and 35.75% thanks to worldwide technological advances and cutting-edge training protocols.
Even countries with shorter histories in the event, like Hong Kong and the Philippines, have seen improvements of up to 31.86% in just 72 and 68 years, respectively. Despite not being countries known traditionally for producing swimming powerhouses, participation in global competitions as well as opportunities for athletes to be trained by international coaches has made these countries serious competitors.
ㅤ
Cycling - The Team Pursuit
ㅤ
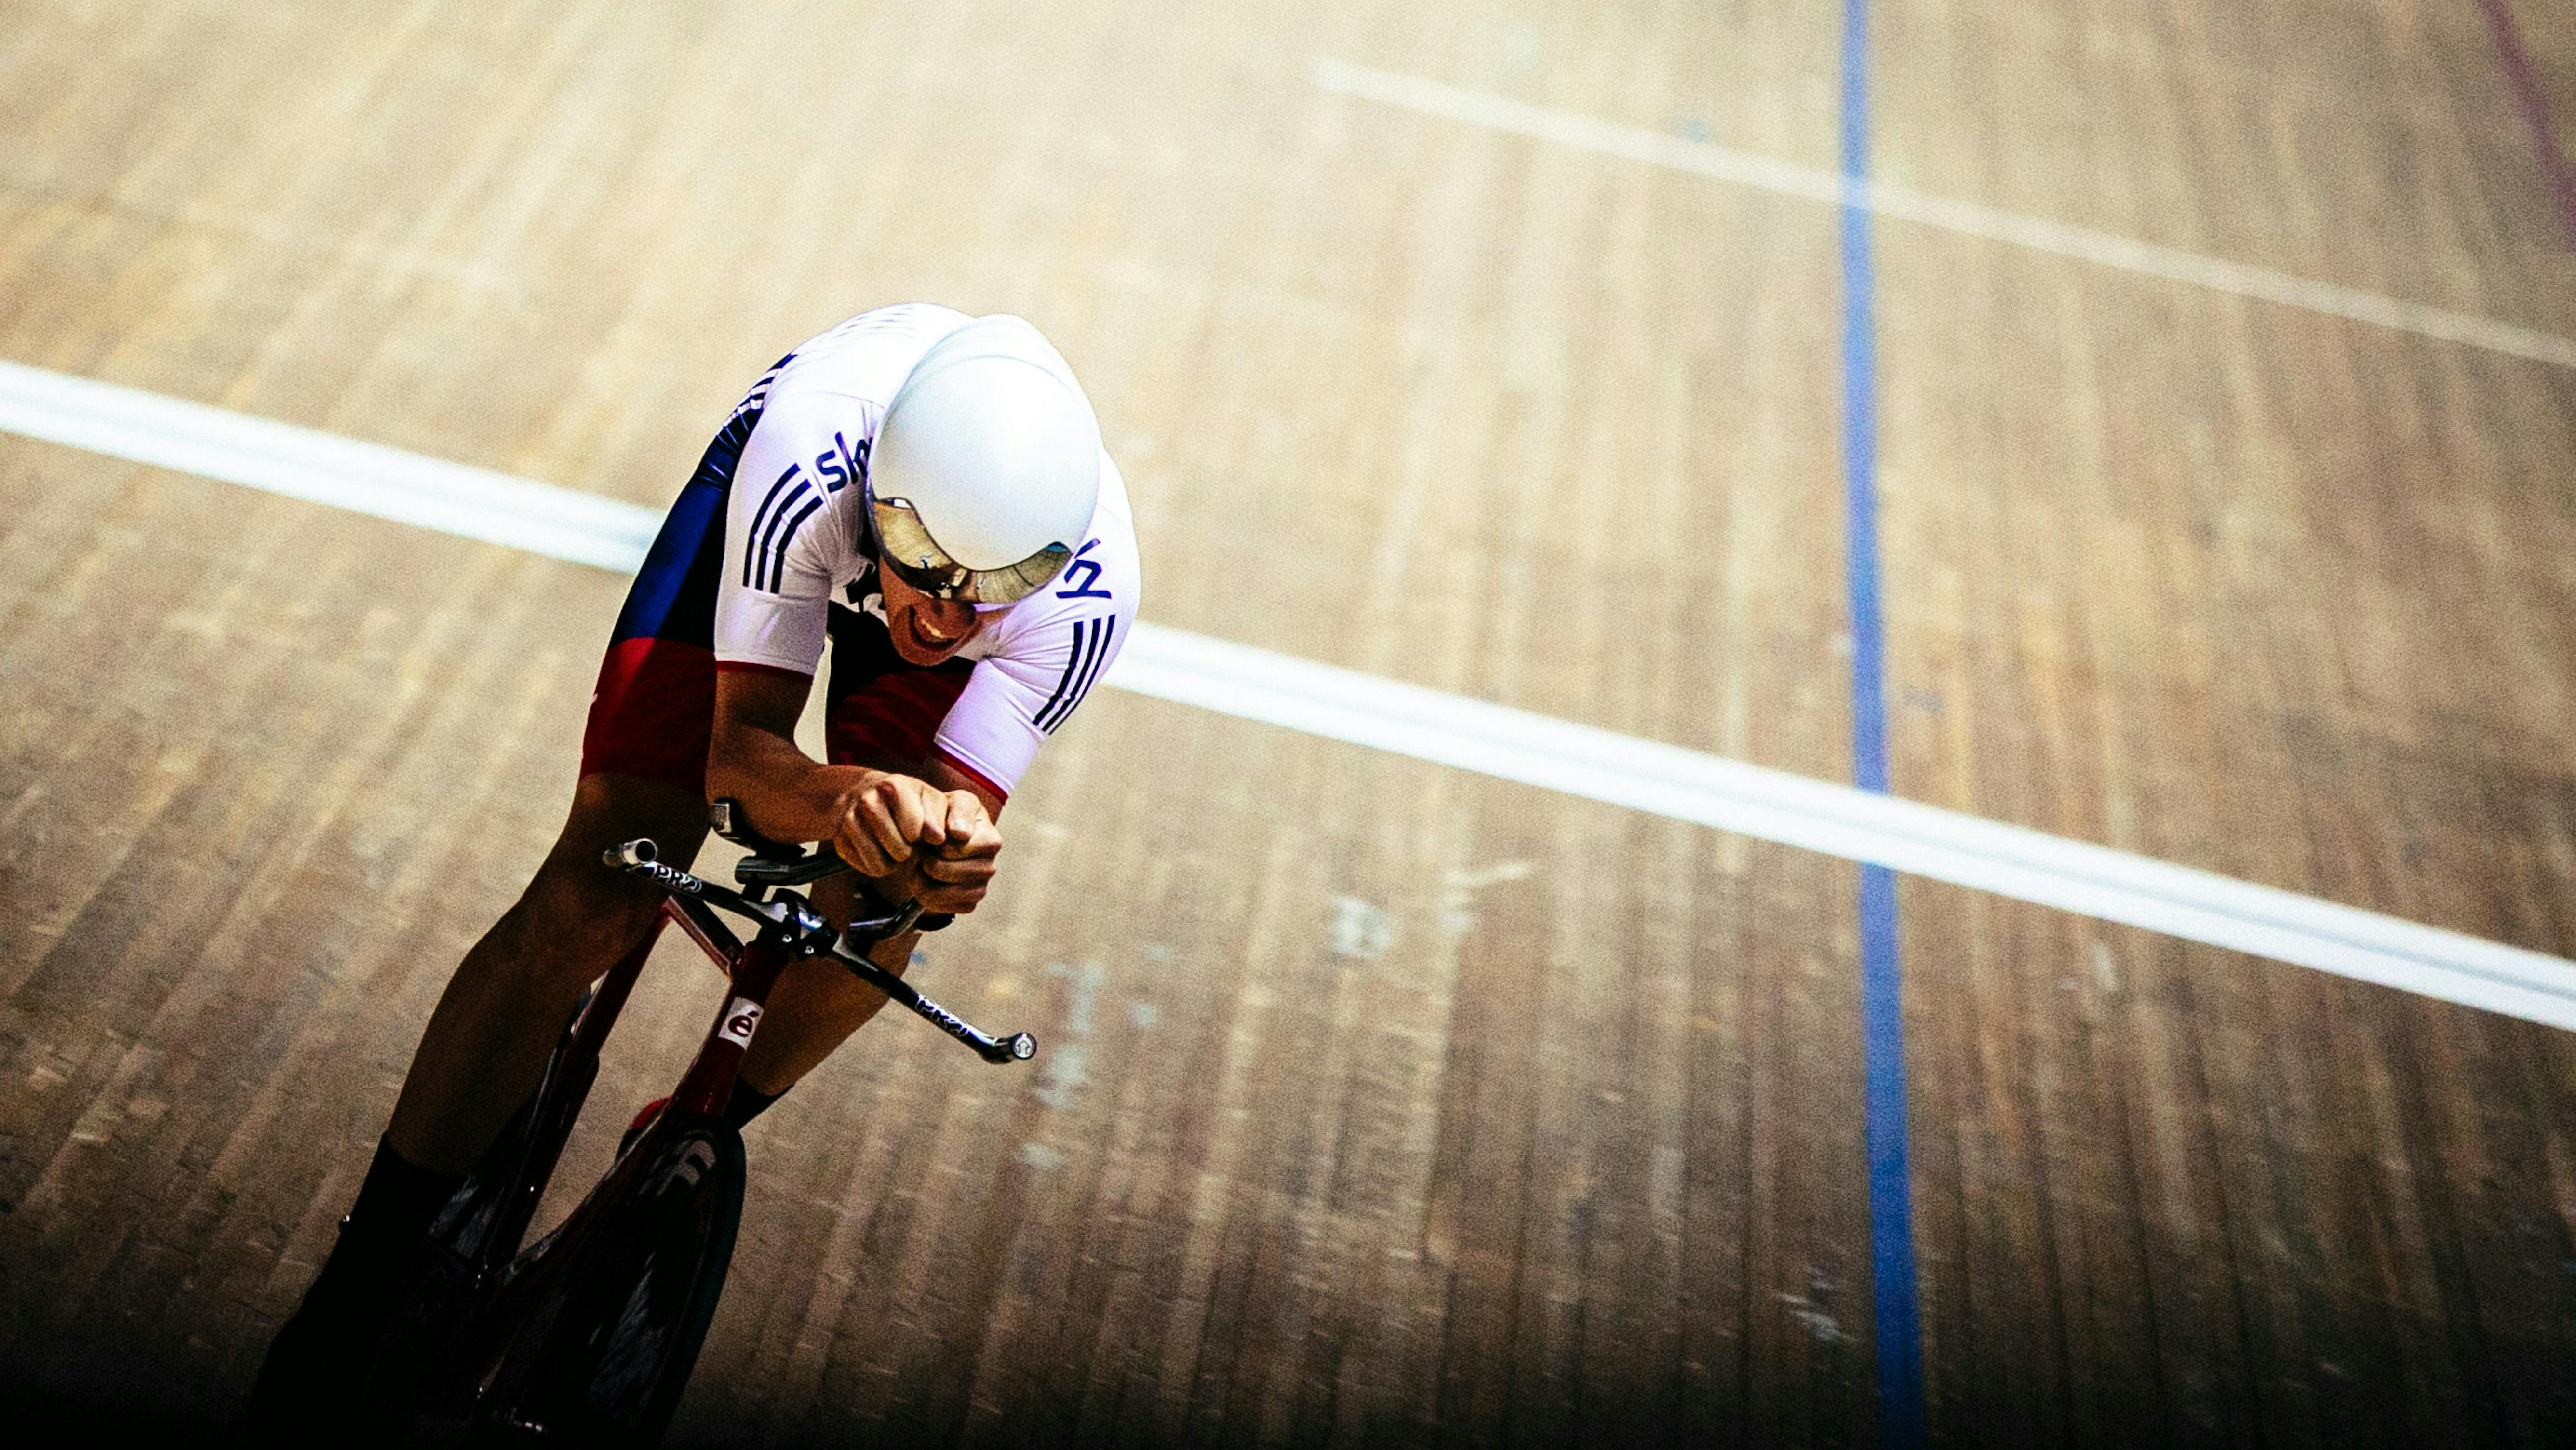
Photo credits: Dylan Nolte on Unsplash
ㅤ
The Olympic team pursuit has been contested by men since 1908, and by women since 2012. The event has always been one of the most iconic in track cycling, but it has evolved, the race distance having changed from 3000m to 4000m for men in 1920, and for women in 2016, and so our analysis focuses on results from these years onward.
The team pursuit requires both speed and tactics, as riders rotate to reduce wind resistance and avoid fatiguing any one member of the team. Perfecting this method of coordination between the athletes and exchange of front runner is difficult and takes significant practice to master.
Like the 100m freestyle, the winning team is often decided by a razor-thin margin - in fact, 2020’s gold was decided by just 0.166 seconds. And while team GB has long dominated the leaderboard for the team pursuit, nations like Italy, Denmark and Australia are appearing as serious challengers, making the event more exciting each year.
Technological advancements tend to have a huge impact in the team pursuit. Highly specialised bikes, aerodynamic cycling gear, and cutting-edge materials like carbon fibre are all key drivers of improvements in race times. Damian pointed out that it’s this technological potential that provides the perfect ingredients for smashing world records in cycling, “The sports with the biggest potential for future world record performance improvements include those ‘newer’ disciplines like swimming, cycling, speed skating, and sailing, where technological innovations play a big role."
ㅤ
Top 10 Most Improved Countries in the Men’s Team Pursuit
ㅤ
| RANK | COUNTRY | CONTINENT | % IMPROVEMENT* | YEARS COMPETED |
| 1. | Denmark | Europe | -31.99% | 100 |
| 2. | Belgium | Europe | -29.51% | 104 |
| 3. | GB | Europe | -29.19% | 104 |
| 4. | Italy | Europe | -28.19% | 104 |
| 5. | Australia | Oceania | -27.99% | 76 |
| 6. | France | Europe | -27.59% | 100 |
| 7. | Canada | North America | -26.22% | 92 |
| 8. | Germany | Europe | -20.27% | 88 |
| 9. | New Zealand | Oceania | -18.65% | 52 |
| 10. | Japan | Asia | -18.32% | 64 |
*(From first, and fastest, to most recent fastest performance)
ㅤ
On the top of the podium for men’s team pursuit is Denmark, whose increase in performance has enabled them to race 31.99% faster over the last century. Denmark has national sports programmes, and along with improved data analytics over this time and improvements in how cyclists train, appears to have put them well ahead of other nations when it comes to improvement over the years.
Following closely behind is Belgium, a country known for its deep love of cycling (particularly in Flanders, which is known for some of the sport’s most iconic road races). Despite being known for road cycling, they appear to be excelling in track events like the team pursuit too, improving their speed by 29.51% over the last 104 years. Meanwhile, Great Britain, who have always been a dominant force in track cycling thanks to world-class athletes like Sir Bradley Wiggins, have made significant leaps in performance over the last century.
Other countries in our study that haven’t competed for the same length of time as the cycling powerhouses already mentioned include Australia, which has reduced its team pursuit time by 27.99% in just 76 years, and New Zealand, who have dropped their team pursuit time by 18.65% in 52 years.
It is also worth highlighting that Japan, who have decreased their overall time by 18.32% in 64 years, have also seen large gains in their performance since the country’s push to excel in Olympic sports. Spurred on by their hosting of the 2020 Tokyo Olympics, it brought greater attention to track cycling and provided athletes with access to better training facilities and coaching ability from around the world.
ㅤ
Top 10 Most Improved Countries in the Women’s Team Pursuit
ㅤ
| RANK | COUNTRY | CONTINENT | % IMPROVEMENT* | YEARS COMPETED |
| 1. | Germany | Europe | -8.22% | 8 |
| 2. | Italy | Europe | -5.89% | 8 |
| 3. | New Zealand | Oceania | -5.78% | 8 |
| 4. | Australia | Oceania | -4.05% | 8 |
| 5. | USA | North America | -3.80% | 8 |
| 6. | GB | Europe | -2.12% | 8 |
| 7. | Canada | North America | -1.61% | 8 |
| 8. | France | Europe | -1.36% | 4 |
*(From first, and fastest, to most recent fastest performance)
NB. Only eight countries that took part in the Paris 2024 Women’s Team Pursuit debuted in an earlier event between 2016 and 2024, so we do not have a full top 10 for this event.
ㅤ
The medal for most improved in the women’s team pursuit, sits firmly with Germany, who have reduced their team pursuit time by over 8% in the last eight years. Known for being a leading cycling nation, Germany’s success is likely driven by years of investment in sports science and racing technology.
Though most of these countries have competed for a similar length of time, due to this event only being contested by women for the last 8 years, Italy and New Zealand are two competitor nations that do stand out in the analysis, improving by 5.89% and 5.78% across just two Olympic Games. The sport is such a new inclusion to the Olympic Games, that we will likely see rapid improvements in performance over the coming years, with huge potential to make innovations in technology that will aid the sport.
ㅤ
Rowing - Single Sculls
ㅤ

Photo credits: Anton Lammert on Unsplash
ㅤ
The single sculls event is one of rowing’s oldest, having been contested by men since 1900 in Paris and women since 1976 in Montreal.
The team pursuit is an extremely physically demanding race, with athletes testing their cardiovascular fitness, strength, technique and mental endurance over a 2000m course that can take place in difficult outdoor conditions if the weather does not hold up.
Similarly to the team pursuit, advances in performance in the sport don’t just come down to individual athletic performance but can be significantly advanced by new technology. Using new lightweight materials, improving the designs of oars and even changing the shape of the boat’s hull can push the sport to new limits constantly, meaning we’re likely to see more records broken in the single sculls in years to come.
ㅤ
Top 10 Most Improved Countries in the Men’s Single Sculls
ㅤ
| RANK | COUNTRY | CONTINENT | % IMPROVEMENT* | YEARS COMPETED |
| 1. | USA | North America | -33.94% | 120 |
| 2. | Hungary | Europe | -32.93% | 116 |
| 3. | Germany | Europe | -31.17% | 116 |
| 4. | Greece | Europe | -18.85% | 76 |
| 5. | Denmark | Europe | -18.23% | 112 |
| 6. | Bermuda | North America | -16.41% | 52 |
| 7. | Romania | Europe | -16.17% | 56 |
| 8. | Netherlands | Europe | -14.60% | 104 |
| 9. | Cuba | North America | -14.36% | 56 |
| 10. | Bulgaria | Europe | -13.97% | 52 |
*(From first, and fastest, to most recent fastest performance)
ㅤ
The USA reigns supreme once again, reducing their men’s single sculls time by 33.94% over 120 years. Dominating the overall medal leaderboard, the USA’s extensive history in elite sports has clearly pushed them to develop an impressive amount during their time competing, and with world-class rowing programmes at universities like Harvard and Yale, it’s no surprise they’ve come so far in the men’s single sculls.
Comparatively, Hungary and Germany who have both also competed for over a century, have improved their performance by 32.93% and 31.17%, respectively.
There are countries with much lower participation periods to highlight too. Greece has reduced their men’s single sculls time by 18.85% over 76 years, while Bermuda and Romania have dropped theirs by 16.41% and 16.17% in just over five decades. Cuba too, have improved their performance a similar amount to the Netherlands, but in half the time - showcasing a true commitment to the sport.
ㅤ
Top 10 Most Improved Countries in the Women’s Single Sculls
ㅤ
| RANK | COUNTRY | CONTINENT | % IMPROVEMENT* | YEARS COMPETED |
| 1. | Algeria | Africa | -13.51% | 28 |
| 2. | Lithuania | Europe | -8.76% | 32 |
| 3. | Peru | South America | -8.46% | 8 |
| 4. | Australia | Oceania | -7.76% | 32 |
| 5. | Uzbekistan | Asia | -7.58% | 20 |
| 6. | Netherlands | Europe | -6.73% | 36 |
| 7. | Iran | Asia | -6.45% | 16 |
| 8. | Germany | Europe | -6.27% | 32 |
| 8. | Togo | Africa | -3.97% | 8 |
| 10. | New Zealand | Oceania | -3.96% | 24 |
*(From first, and fastest, to most recent fastest performance)
ㅤ
Algeria takes the gold for most improved in women’s single sculls, reducing their time by 13.51% over 28 years, a margin of almost 5% greater than Lithuania and Australia, both of which have competed for longer.
Notably, Peru, who despite only competing for 8 years, has improved by 8.46% - almost the same amount as Lithuania, who have competed for four times as long.
Similarly, Uzbekistan, Iran, and Togo have all improved their performance by an impressive rate over the past eight to 20 years - with such impressive improvements in such a short space of time, the future of the sport looks set to be an interesting watch.
ㅤ
How We Calculated Each Country’s Improvement – Paralympics
To decide how much different countries have progressed since their Paralympic debut, we looked at which countries had more Paralympic athletes taking part in 2024, compared to their first ever Games. Although most events in the Paralympics have categories that represent the impairment of each athlete to ensure they compete against those with similar levels of impairment, we decided to look at the number of participants from each country, to provide a fair and consistent comparison of each country’s Paralympic progression.
ㅤ
Overall Paralympic Participation
The Paralympic Games were launched after World War II, to aid the vast number of individuals that had left the war needing rehabilitation, but sport for athletes with impairment has existed for a much longer period of time.
In the Paris 2024 Paralympic Games, over 4,000 Paralympic athletes from 170 different nations took part in 549 different medal events, and three nations made their debut - Eritrea, Kiribati and Kosovo.
ㅤ
The Top 10 Countries Who Have Increased Their Paralympic Participation The Most Overall
ㅤ
| RANK | COUNTRY | CONTINENT | % CHANGE* | YEARS COMPETED |
| 1. | Turkey | Europe, Asia | 9,200% | 32 |
| 2. | Uzbekistan | Asia | 6,400% | 20 |
| 3. | Egypt | Africa | 5,300% | 52 |
| 4. | South Korea | Asia | 4,050% | 56 |
| 5. | Brazil | South America | 3,100% | 52 |
| 6. | Tunisia | Africa | 2,900% | 36 |
| 7. | Ireland | Europe | 2,800% | 64 |
| 8. | France | Europe | 2,072% | 64 |
| 9. | Sweden | Europe | 1,900% | 60 |
| 10. | Thailand | Asia | 1,850% | 40 |
* (in participant numbers)
ㅤ
Turkey sits atop the podium, having increased their Paralympic participation more than any other nation - by 9.200% in just 32 years. Thanks to the creation of a dedicated Paralympic training centre in Aksaray, opportunities for Paralympic athletes have increased substantially, and they’ve now won 66 medals to date since their Paralympic debut.
Following closely behind is Uzbekistan, who have increased their Paralympic participant numbers by 6,400% over the last two decades. Just this year at the Paris 2024 Paralympics, Uzbekistan achieved their highest medal tally and sent more participants than ever before. Completing the top three is Egypt, whose participation has increased by 5,300% in 52 years.
Other notable countries that have increased the number of their para-athletes since their debut in the Games include Tunisia and Thailand, both of whom have managed to increase their participation by similar levels to the likes of Ireland and Sweden, but in much less time. Tunisia has excelled at the Paralympics, with powerhouse and six-time Paralympic champion Raoua Tlili now widely known for her successes, meanwhile Thai Paralympic athletes have also made a name for themselves, with athletes dominating the Para table tennis leaderboards. Thailand has made significant investments in Paralympic sports in recent years, hosting events like the World Paralympic Qualification event and exposing its athletes to international competition.
ㅤ
Para-athletics
Para-athletics is one of the oldest Paralympic sports, having been contested at the Games since 1960 in Rome. It is open to male and female athletes with a range of impairments, including the visually impaired, intellectually impaired, those with cerebral palsy, brain trauma, short stature, limb deficiencies, and impaired muscle power or impaired range of movement.
Para-athletics includes a range of track and field events just like the Olympics, and utilises adaptations like guide runners, use of prosthetics and wheelchairs.
ㅤ
The Top 10 Countries Who Have Increased Their Para-athletics Participation The Most
ㅤ
| RANK | COUNTRY | CONTINENT | % CHANGE* | YEARS COMPETED |
| 1. | Japan | Asia | 3,900% | 60 |
| 2. | United States | North America | 2,650% | 64 |
| 3. | France | Europe | 2,600% | 64 |
| 4. | Tunisia | Africa | 2,400% | 36 |
| 5. | Thailand | Asia | 1,400% | 40 |
| 6. | Colombia | South America | 1,300% | 28 |
| =6. | Netherlands | Europe | 1,300% | 64 |
| 8. | Great Britain | Europe | 1,000% | 64 |
| 9. | Australia | Oceania | 967% | 64 |
| 10. | Brazil | South America | 914% | 52 |
* (in participant numbers)
ㅤ
Japan takes gold in para-athletics, with a 3,900% increase in para-athletes competing since their debut 60 years ago. Japan’s rise has taken place over half a century, but their hosting of the Tokyo 2020 Paralympics certainly raised public awareness. Similarly, the country hosted the 2024 World Para Athletics Championships in Kobe, Japan, further cementing their commitment to the sport.
Following behind Japan is the USA, whose equally long history of competing in the Paralympics (64 years) has contributed to them growing para-athlete numbers by 2,650%, while France completes the top three with similar figures, para-athlete numbers increasing by 2,600% over the last 64 years.
Other notable countries who have increased participation over short time periods include Tunisia, who have hosted events like the Tunis Grand Prix, and Colombia, who have made significant improvements in inclusion, with initiatives backed by the International Paralympic Committee that have created hundreds of new para-athletes in the country.
ㅤ
Para-cycling
Road Para-cycling made its debut in 1984, and Track Para-cycling in 1996, with both sports now an integral part of the Paralympic Games. Similarly to Para-athletics, the sport is open to those with cerebral palsy, amputations and other physical impairments.
Athletes in the sport compete using different types of bikes, from handcycles, to tandem bikes and tricycles and similarly to cycling in the Olympics, records are being broken all the time due to improvements in individual athletic performance, as well as technological improvements to equipment used, like carbon-fibre frames and aerodynamic helmets.
ㅤ
The Top 10 Countries Who Have Increased Their Para-cycling Participation The Most
ㅤ
| RANK | COUNTRY | CONTINENT | % CHANGE | YEARS |
| 1. | Great Britain | Europe | 2,200% | 40 |
| 2. | Ireland | Europe | 900% | 32 |
| 3. | Brazil | South America | 500% | 32 |
| =3. | Malaysia | Asia | 500% | 12 |
| 5. | United States | North America | 400% | 40 |
| =5. | Thailand | Asia | 400% | 4 |
| =5. | Colombia | South America | 400% | 20 |
| 8. | Argentina | South America | 300% | 20 |
| 9. | Romania | Europe | 100% | 20 |
| =9. | Poland | Europe | 100% | 20 |
ㅤ
Great Britain takes the Paralympic gold for cycling, thanks to a huge 2,200% increase in participation over the last 40 years. Thanks to programmes like British Cycling’s Limitless which was launched in 2023, thousands of disabled cyclists have had the opportunity to develop their skills and join the sport. Thanks to this increase in participation over nearly half a century, team GB won five golds at the Paris 2024 Paralympic Games.
Completing the top three countries who have increased their para-cycling participation the most is Ireland (900%) and Brazil (500%). Both countries have been competing in the Paralympics for 32 years.
Other results to highlight include Malaysia and Thailand, whose rapid growth in para-cycling over the past 12 and 4 years, respectively, is impressive - particularly when compared with the likes of Brazil, the USA and Colombia, all of whom have seen similar rates of growth, but over much longer periods of time.
ㅤ
Para-swimming
Para-swimming is another of the oldest Paralympic sports, contested since the first Games in 1960, and swimmers compete in freestyle, backstroke, breaststroke and butterfly, and medley events.
Unlike Para-cycling, the sport is free of technology, so there is no use of prosthetics or assistive devices like wheelchairs in competition, and the classification system is based on functional abilities in the water rather than type of disability like in some other Paralympic sports.
ㅤ
The Top 10 Countries Who Have Increased Their Para-swimming Participation The Most
ㅤ
| RANK | COUNTRY | % CHANGE* | CONTINENT | YEARS COMPETED |
| 1. | Brazil | South America | 3,600% | 52 |
| 2. | Australia | Oceania | 2,900% | 64 |
| 3. | Mexico | South America | 2,200% | 52 |
| 4. | France | Europe | 1,300% | 64 |
| 5. | Spain | Europe | 750% | 56 |
| 6. | Colombia | South America | 700% | 32 |
| 7. | Uzbekistan | Asia | 600% | 16 |
| 8. | Turkey | Europe, Asia | 500% | 24 |
| =8. | Ireland | Europe | 500% | 64 |
| 10. | United States | North America | 450% | 64 |
* (in participant numbers)
ㅤ
Brazil sits on top of the podium in para-swimming, with a hefty 3,600% increase in participation over the last half a century. With consistent investment in elite sports, and thanks to hosting the Rio 2016 Paralympic Games, the country sent over 250 athletes to Paris 2024.
Australia follows closely behind, the country having increased its number of Paralympic swimmers sent to Olympic Games by 2,900% over the last 64 years, while Mexico completes the top three (a 2,200% increase over 52 years).
Other notable countries include Uzbekistan and Turkey, who have both seen high rates of growth in their Paralympic participation that match that of Colombia and Ireland, but in half the time.
ㅤ
So, what does the future of elite sports look like? And will we continue to set new world records, or will we hit a physiological ceiling? Damian doesn’t think so.
"While physiological limits will eventually be reached, Olympic records will continue to be broken because the spectacle demands it. New resources, like nanomaterials or artificial tissues, could help produce new records, alongside further refinement in measurement methods like recording times in milliseconds or adjusting race rules."
Every sporting discipline will adapt to give the crowds the thrilling prospect of new records, or simply be replaced by other events that do! Perhaps one day we’ll cheer on sprinters running in a wind tunnel against a 30 km/h headwind, chasing records timed to microsecond precision. And while the Olympics ‘ooze’ tradition, the recent advent of new sports including skateboarding, sport climbing, surfing, 3x3 basketball and breaking are perfectly poised to start setting new world records of their very own!”
2024 has been an epic year for sport, with the Paris Olympics and Paralympics showcasing the best the world has to offer. With so many fantastic sportspeople inspiring people all over the world that they can follow their dream, no matter where they’re from, how old they are or what they’ve been through - we hope the games have given you all the inspiration you need to start that new sport too. For guidance on all things training related, head to our advice hub for the latest tips, tricks and workout advice.
ㅤ
Methodology
ㅤ
Olympics
2024 Olympic results for the 100m sprint, 100m freestyle, single sculls and the team pursuit were recorded. Each country's 2024 score was then compared to their first Olympic result. Each nation's fastest time was taken. If a nation had multiple individuals or teams competing, the individual or team with the quickest time was taken. Any disqualified results were excluded.
In some cases, a country may have competed in an earlier Olympics than recorded in our data. In these instances, this is because their time was not recorded or is not available online. For these countries their 'first' ever result is the first one we could find recorded online.
Women's team pursuit was only introduced as an Olympic event in 2012, and the race distance was changed from 3000m to 4000m in 2016, so results were taken from 2016 onwards. Men's team pursuit results were taken from 1920 onwards, as the race distance changed from 3000m to 4000m before this.
The official Olympics website uses hand watch times for 100m sprint results, and automatic results if no hand watch time is recorded. So, if no hand watch time could be found for a country's first or last appearance, automatic time was taken instead.
The percentage change between each nation's fastest first and last result was calculated and used to rank each Country's progression in a given sport. The number of years between the two results was also calculated. Countries that didn't take part in the 2024 Olympics were excluded. Countries that only competed in 2024, and therefore didn't have two results to compare were also excluded. Data correct as of August 2024.
ㅤ
Paralympics
Total participants for each country in the 2024 Paralympics were recorded and compared with total participants present at the same country's debut Paralympics. These two figures were compared to determine which countries have improved most athletically. In addition, each country's 2024 Paralympic participants and debut Paralympic participants in athletics, cycling and swimming were compared to find out which countries have improved most in those specific sports.
Most events in the Paralympics have 'categories' that represent the impairment of each athlete to ensure athletes compete against those with similar levels of impairment. Due to this, we looked at the number of participants from each country, rather than the results in each category, to provide a more consistent comparison of a country's Paralympic progression.
The percentage change between each nation's first and most recent participant numbers was calculated and used to rank Paralympic progression. The number of years between the two results was also calculated. Countries that didn't take part in the 2024 Olympics were excluded. Countries that only competed in 2024, and therefore didn't have two results to compare were also excluded. The Refugee Olympic Team was also excluded as they represent multiple countries, making the data difficult to compare.
ㅤ
Data correct as of September 2024.
ㅤ
Sources
https://www.olympiandatabase.com
https://olympics.com/en/paris-2024/paralympic-games/sports/para-athletics
ㅤ
Are you feeling inspired? Then join our SportsShoes Strava Run Club and become part of our inclusive community.
And for more inspirational tips to become stronger, better and happier, then check out our Motivation category. Because it’s no fun standing still.
Welcome
Welcome to the SportsShoes Motivation Hub! From real-life stories, tips and inspiration, here you'll find everything you need to motivate you to keep pushing your limits and break PBs.